
The first part of phase 2 of the sprint process was interactive as it was intricate. Once my team made our sketches of our finance app from the previous week, it was time to transition into the next phase of the sprint. We proceeded to partake in various voting methods to determine the exact features that our app will contain, as well as the user flow exercise to decide on the best chain of events that users of our app will take. Finally, we created a storyboard, a step-by-step visual of the ideal path of how users with interact with the prototype. It was the most involved that I’ve felt during my first sprint journey so far! Let’s break it down!
Heat Map and Straw Pole Voting
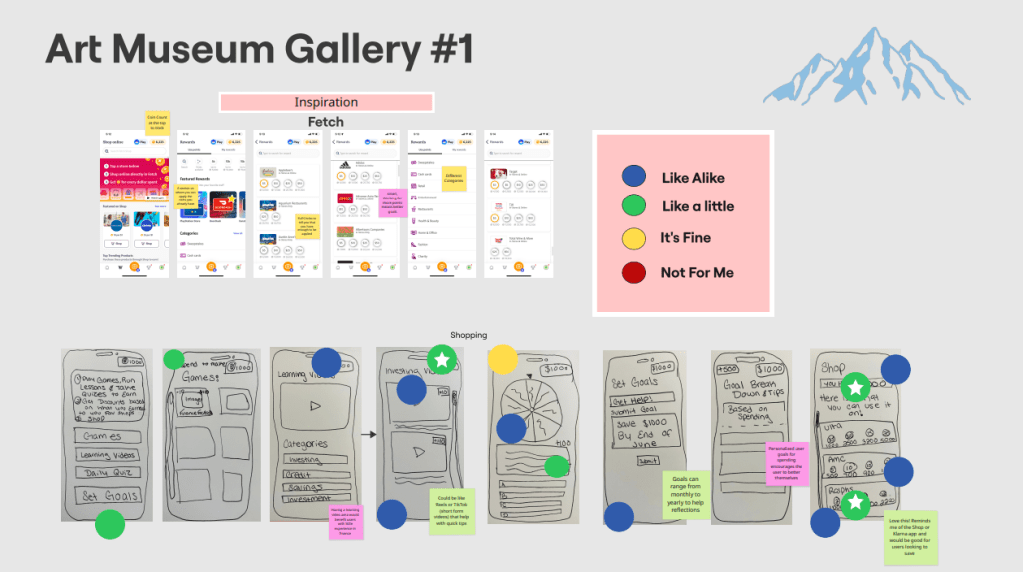
Heat Map voting was the first method we used to pinpoint what the undisputed best features for our finance app could be. It’s when all team members examine each members set of sketches, quietly place dots onto them. The dots themselves are different colors that indicate if that team member liked or disliked the sketch or not. For example, a blue dot means we liked the sketch and idea a lot, and a red dot means the sketch and feature wasn’t for us personally. We took about 5 to 6 minutes carefully examining each members sketches and being honest, yet anonymous, about what we want and don’t want on our app. I thought that Chloe’s shop, where you can spend your hard earned points on rewards like gift cards, was a very cool idea that I liked a lot! I immediately gave it a blue dot!
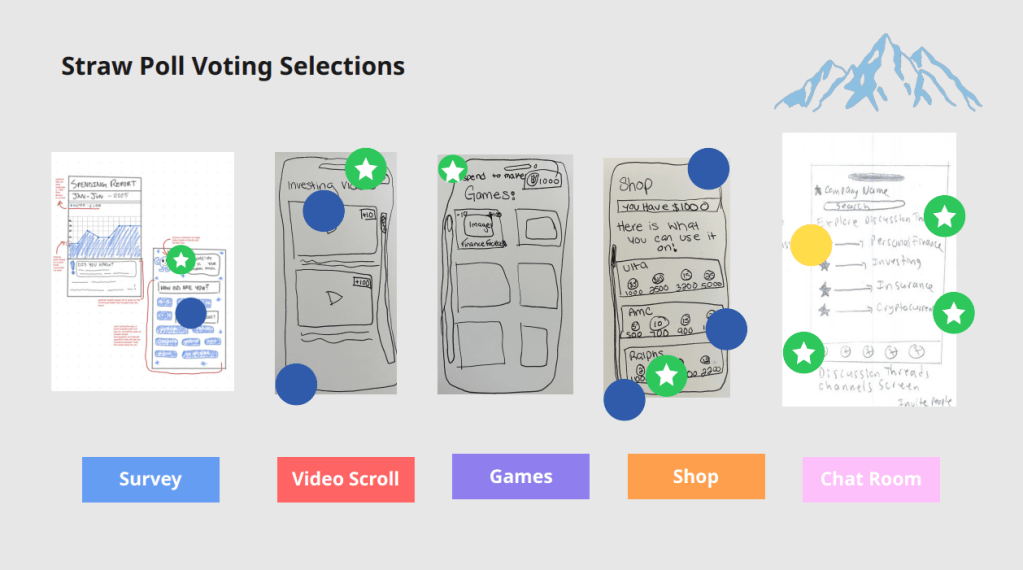
Next the Blue Team kicked off the Straw Pole voting process! This narrows down the app features even further by picking the most popular picks from the Heat Map vote and placing one green/white star dot on our favorite sketches and ideas. Our findings and results came out to be the intro survey, interactive games, video scrolling/tutorials, a shop, and chat rooms! Through a deeper understanding of the user, surveys are a clever, quick, and useful tool to significantly improve both initial impressions and long-term success. Any program can benefit from video scrolling as it’s quick, entertaining, customizable, addictive, and simple to use. It makes use of the psychology of reward, validation, and curiosity. Learning is slipped into games so that it feels like play. They capture interest, foster emotional engagement, and establish a secure environment for trying, failing, and growing. They are therefore perfect for imparting knowledge to a younger audience, such as Gen Z. Earning points for discounts at popular stores and activities like going to the movies makes managing money feel enjoyable, practical, and gratifying. It’s a stepping stone to greater financial understanding. Instructing Generation Z on smart spending, strategic saving, and how to make money work for them. Financial literacy becomes a communal experience in chat rooms. They make learning safe, social, and encouraging. Gen Z is a perfect match for this since they favor community over solitude and collaboration over lectures.
User Flow and Storyboarding
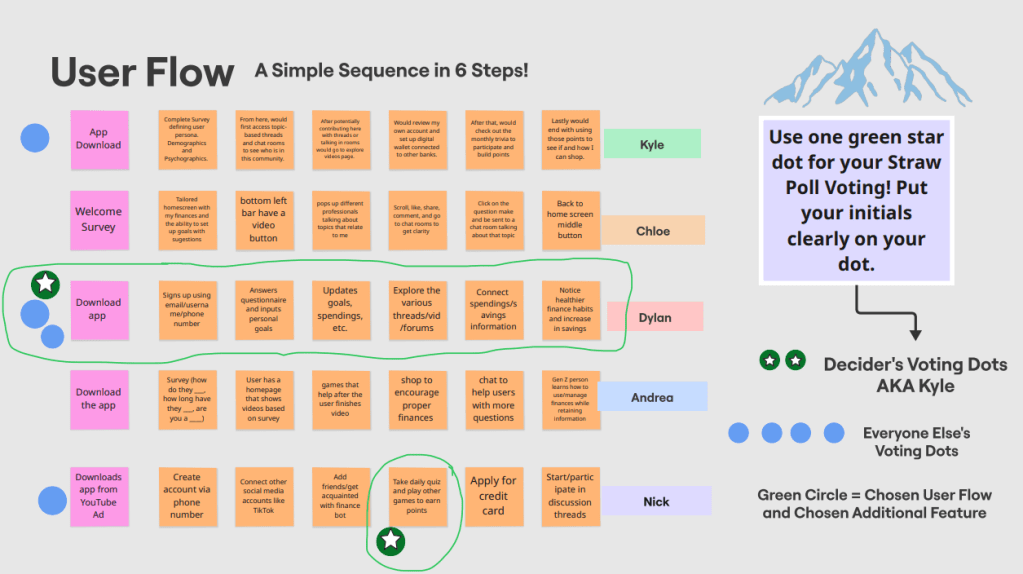
A user flow illustrates the actions a user takes to finish a task on a website or in an application. It outlines every screen the user sees everything from beginning to end and demonstrates their movement through the experience. For example, the user path that I came up with went like this: Downloads app from YouTube ad, creates account via phone number, connects other social media
accounts like TikTok, add friends/get acquainted with finance bot, take daily quiz and play other games to earn points, applies for credit card, and start/participating in discussion threads. Kyle was our decider for this exercise, the one who makes the final say for the user flow. The decider gets green circle/white star voting dots while the rest of the team gets blue ones. We ultimately went with Dylan’s user flow being the most fitting for the majority of Gen Z to follow!
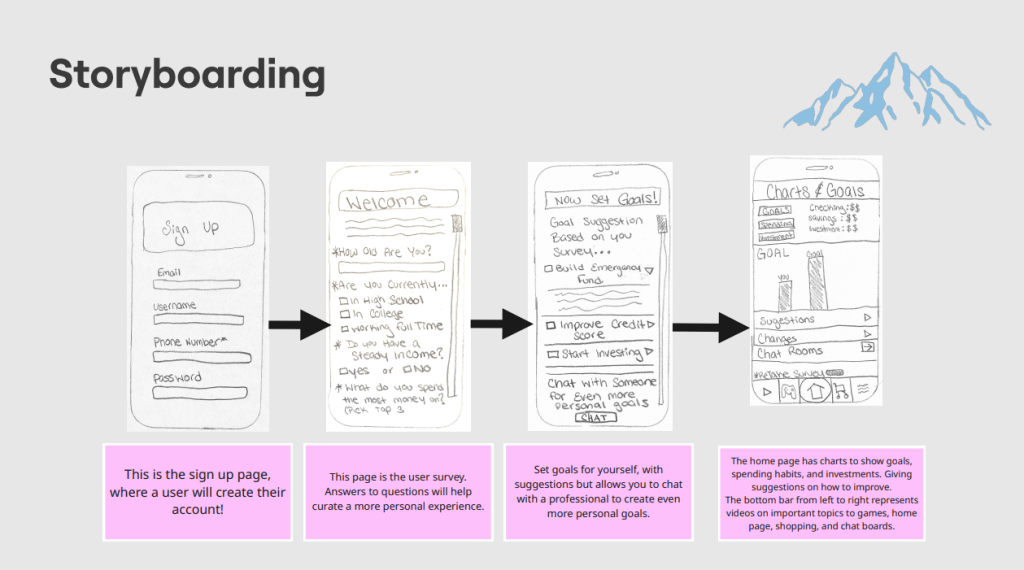
Finally, storyboarding is the process of creating a step-by-step visual plan that outlines what your prototype will look like and how a user will interact with it. I made my own sample storyboard before my team meeting to get an idea of what exactly it’s supposed to be, using various sketches that we drew up from the previous exercise. It’s actually just piggybacking off of the user flow portion of phase 2 of the sprint! Since Dylan’s user flow was chosen, Chloe then modeled the new sketches for the storyboard off of that path! Users would start with the signup page, then the survey, followed by a consultation with a professional in finance to help set goals for themselves, and finally the home page, where the app shows their current goals, spending habits, and investments.

Leave a comment