By Nicholas Pagonis
Teams frequently have trouble making choices with clarity and alignment in the fields of product strategy and user experience (UX) design. What criteria do you use to determine the relative importance of different features? What are the most pressing requirements of the users? What are the most important problems? The 2×2 Matrix approach, which is simple, organized, and quite visual, aids UX professionals in making well-considered judgments and expressing them in a clear manner.
A 2×2 matrix is, at its foundation, a grid with two axes, each of which represents a different dimension that is important to your issue. Based on where things are located along these axes, the grid splits material into four quadrants. Prioritization, strategic planning, feature scoping, and customer segmentation are typical applications in UX. Items are placed in the quadrants, which provides insight into patterns and guides decision-making.
Because it immediately clarifies trade-offs, helps visualize complexity so teams may reason together, brings stakeholders in line with decisions, and aids in facilitation during workshops or planning sessions, UX designers utilize it. It’s especially helpful when it comes to balancing conflicting viewpoints, like business objectives, user requirements, and technological limitations.
Here is a straightforward six-step procedure for utilizing the 2×2 matrix:
- Determine Your Objective
Begin by posing a specific question that you want answered. For instance:
“Which features should we develop in the upcoming quarter?”
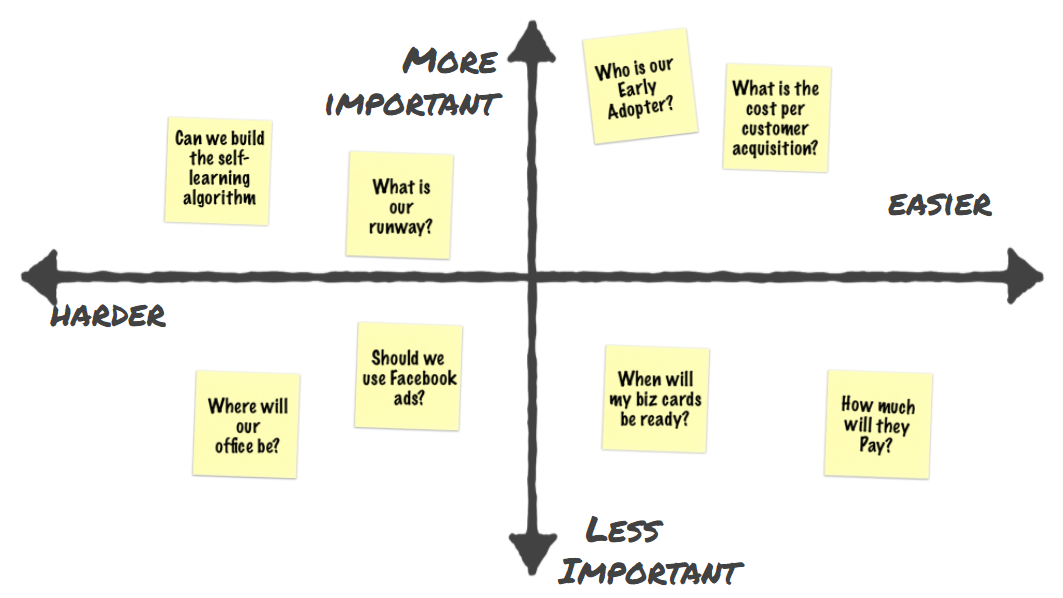
- Select Your Axes
Choose two aspects that will aid in your assessment of products. A typical illustration:
Value to users along the y-axis (Low → High)
Effort to implement (Low to High) on the X-axis
Use independent dimensions, and make sure the meaning of the axes does not overlap.
- Make a list of your belongings.
Collect the things you want to evaluate, such as potential features, research possibilities, usability challenges, and so on.
- Put the things on the grid.
As a group, decide where each piece belongs among the four quadrants:
Low effort, high effort
Major Projects, High Value, Quick Wins
Time wasters with little value
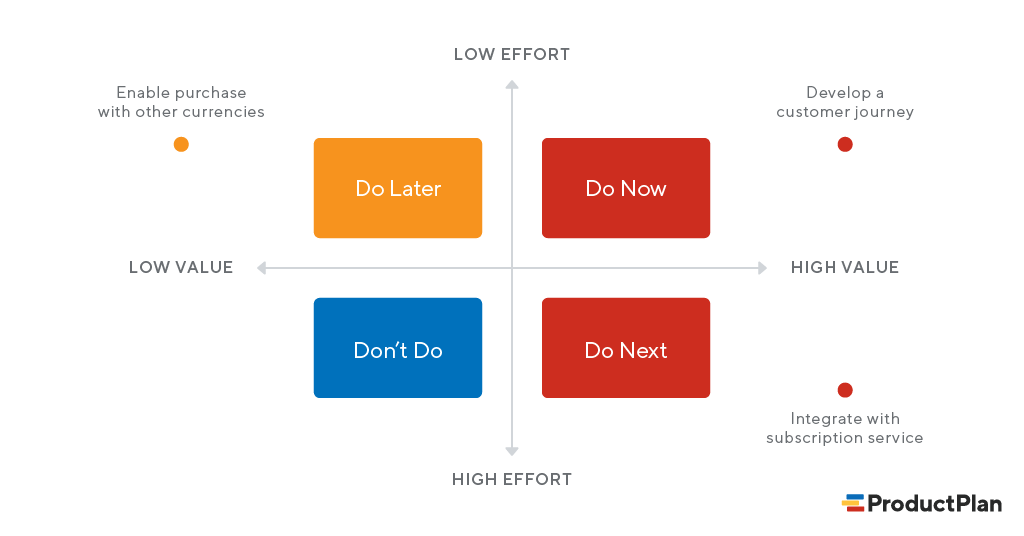
- Examine Quadrants
The meaning of each quadrant is as follows:
Rapid Wins: high worth, little effort → Prioritize this.
Key Projects: High Value, High Effort → Make a careful plan
Fill-Ins: Low effort, low value → It’s good to do.
Time Wasters: High effort, little worth → Avoid/Postpone
- Choose and Take Action
Use the matrix as the foundation for prioritization and alignment. Record choices and future actions.
Depending on your workflow and team, you may use a variety of tools to make 2×2 matrices:
Whiteboards for the Internet
Ideal for real-time workshops and collaboration:
Miro
Mural
FigJam
With these, teams may iterate, vote, comment, and drag and drop sticky notes into quadrants.

Tools for Planning and Productivity
Ideal for documentation and roadmap integration:
Notion
Trello
Airtable
You can include snapshots or matrices into your larger strategy pages.

Instruments for Design
To communicate polished visuals with stakeholders:
Figma
Sketch
Adobe XD
Designers have the ability to integrate artifacts directly into UX deliverables and create unique matrices.

Spreadsheets
Easy to use and simple:
Google Sheets
Microsoft Excel
Use cells to symbolize objects after just naming two axes.

The 2×2 matrix itself is not a topic of psychological investigation, but it is frequently cited in studies of UX and decision-making. The matrix has a role in the following examples taken from the academic and practical literature:
- Prioritization of Features in Agile UX
In a 2020 publication of the Journal of Systems and Software, the authors examined how agile teams prioritize features. Compared to ad-hoc prioritization, the study discovered that teams that used structured prioritization tools, such as 2×2 matrices with Value vs. Effort, made more consistent choices and had considerably better alignment between UX, business, and engineering stakeholders. The transparency and conflict were reduced by the use of structured matrices. (Journal of Systems and Software, 2020)
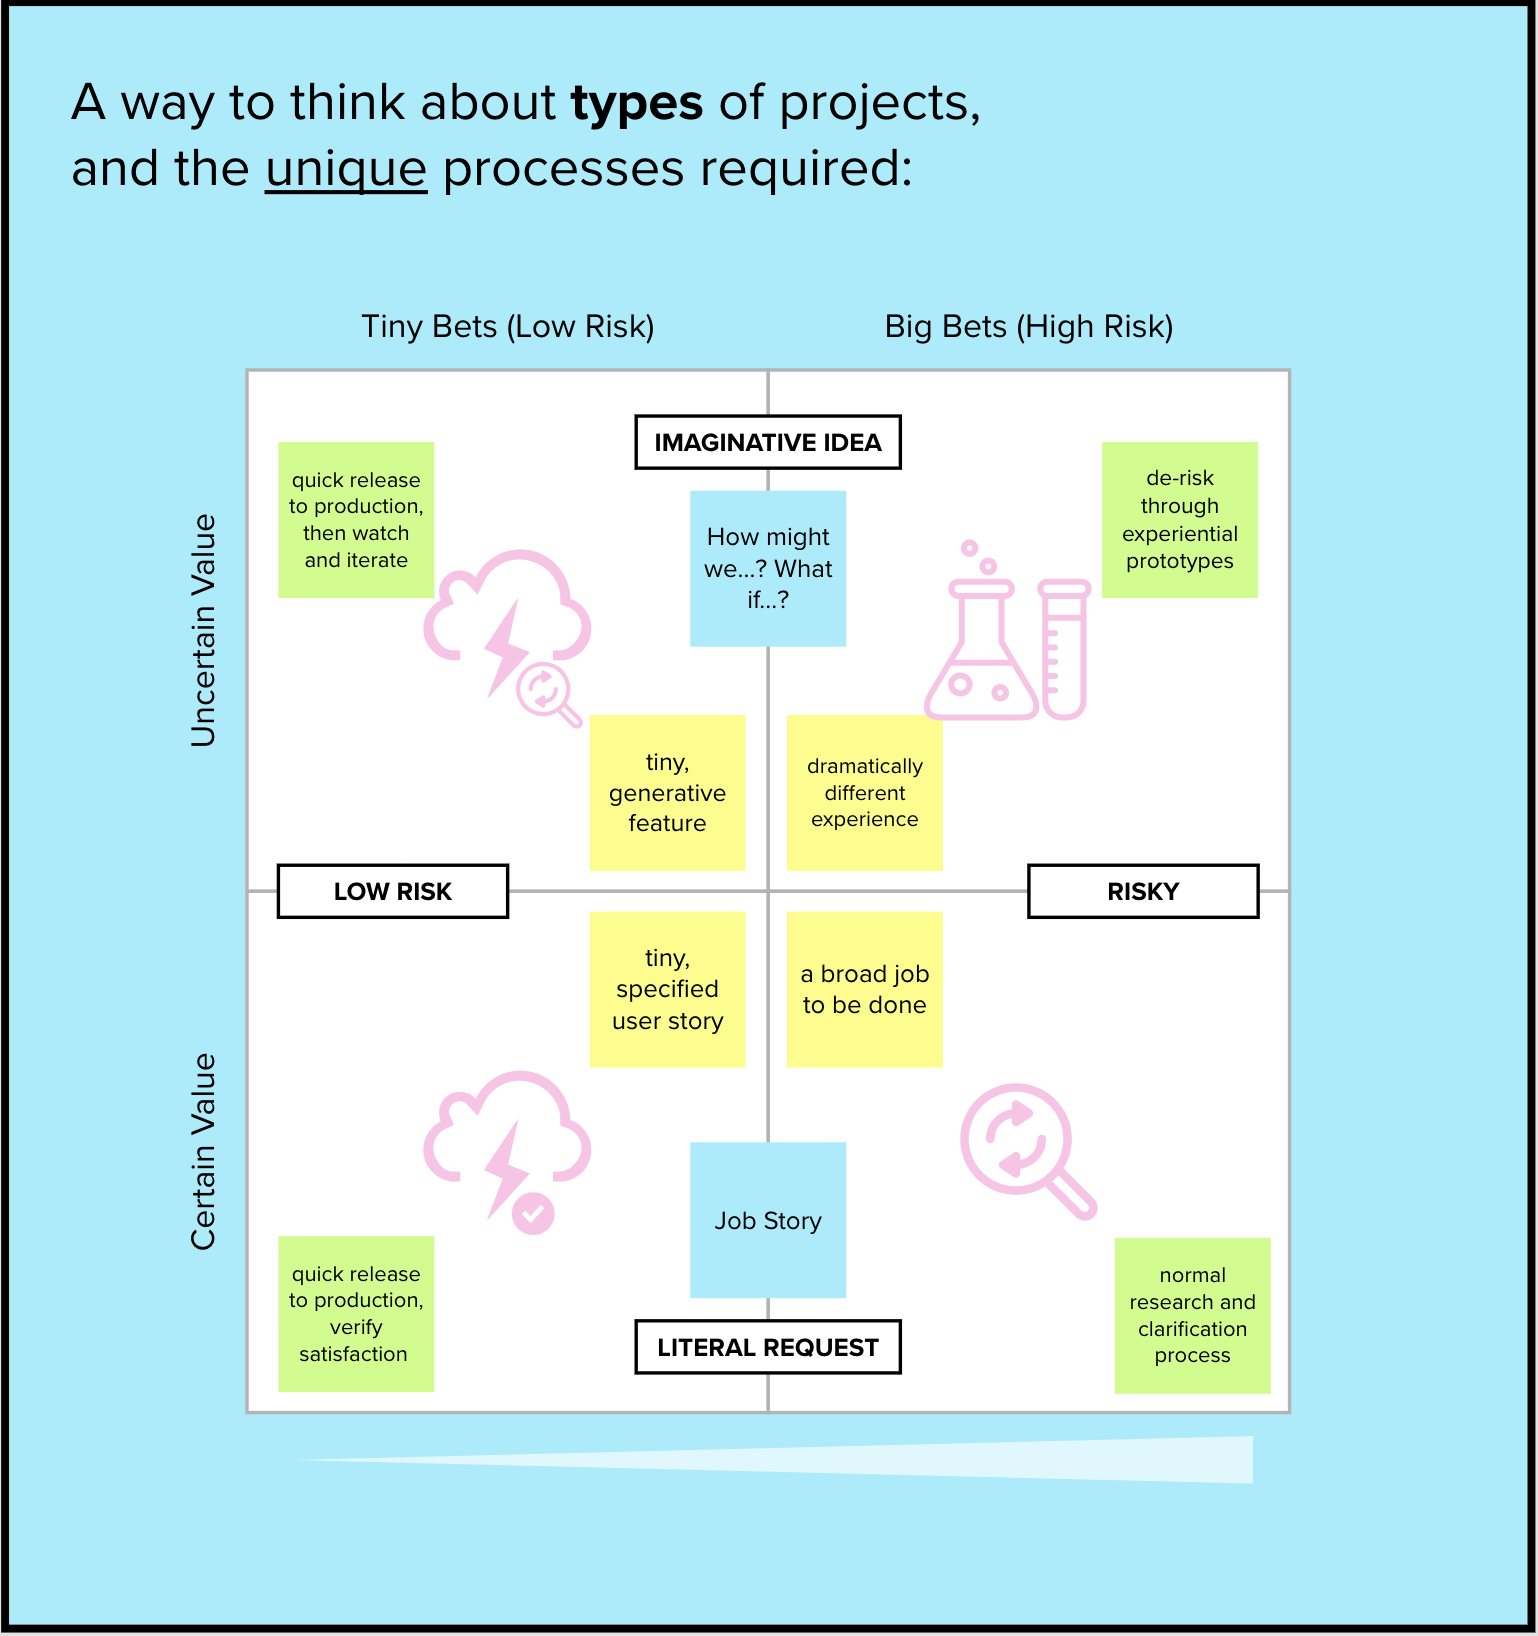
- Making Decisions in the Face of Uncertainty
As part of decision framing methodologies, researchers researching product teams in Information and Software Technology (2018) employed a variation of the 2×2 matrix. Teams that visually externalized criteria, such as risk and confidence axes, were more adept at spotting underlying biases and mitigating bias. Cognitive aids were provided by visual matrices. (Information and Software Technology, 2018)
- Evaluation of the Severity of Usability Issues
Using a quadrant model to categorize usability concerns by Severity vs. Frequency, a 2019 research in Behavior & Information Technology examined usability from the standpoint of a usability evaluation. According to the matrix, certain high-severity problems occurred rarely and were mistakenly de-prioritized, causing teams to rethink trade-offs. The quadrant approach helped to strike a balance between impact and prevalence. (Behavior and Information Technology, 2019)

The 2×2 matrix is a straightforward but effective UX technique for helping people make difficult choices. The matrix helps teams see trade-offs, make aligned judgments, and take action with certainty, whether they are prioritizing features, planning research, or categorizing insights.
Give it a go during your next design sync, and see how clarity takes the place of perplexity

Leave a comment